Trade Reveal (As of 4/18/2018)
Today's reveal is a mildly bullish trade using an options strategy called a bull/put credit spread. We're trading an equal amount of contracts of put options on the stock, Home Depot (Symbol - HD.) We set up the trade by selling the May 4, 2018, 172.5 strike price put options at $0.66, and buying the May 4, 2018, 170 put options at $0.42 for a net credit of $.024. This trade has a 88% win probability, a maximum gain percentage of 10.6% and a trade duration of 16 days or less. The break even price is 172.26 and is 7.59 points below the current price of 179.85.
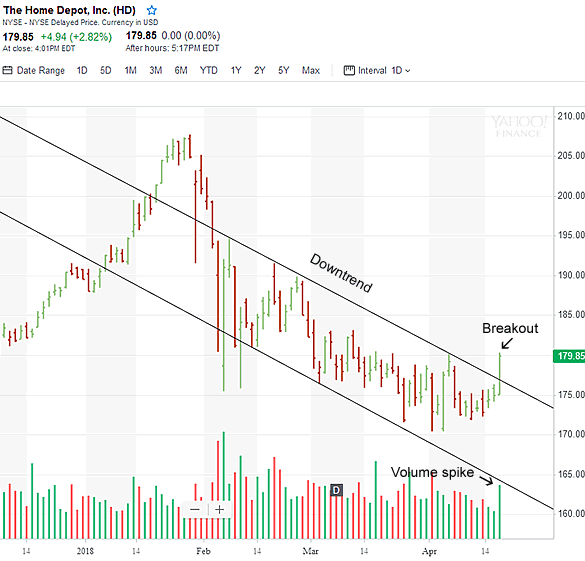
The technical analysis:
When studying the 6 month stock chart, (see image of chart below) my outlook for at least the short term is bullish, and additionally supports my favoritism of the trade. As seen in the Home Depot stock chart image below, the stock has been in a downtrend since early February, 2018. Today, April 18, 2018, the stock price closed up at 179.85 on volume that's better than the 90 day average and showing a breakout from the 3 month downtrend. The breakout could be a sign of a trend reversal to the upside. Since the stock's 200 day moving average is at 172.50 which can provide a level of price support along with today's breakout from the 3 month downtrend, I believe it provides a good entry point for the trade.
Trade example:
If a trade was put on using put options with the expiration date, May 4th, to both sell 20 contracts of the 172.50 strike puts and buy 20 contracts of the 170 strike puts at a net credit of $0.24, the margin (risk) would be $4,520 for a maximum profit of $480, and a maximum yield of 10.6% over a trade duration period of 16 days or less.
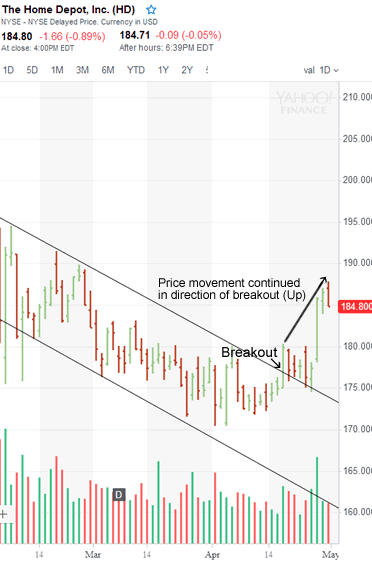
Following up the trade (As of 4/30/2018)
So, since the breakout reversal to the upside that occurred on April 18th, as we follow the continuation of the daily stock price movement, (see chart image below) we see that it has continued in that direction with Home Depot closing today at 184.80, up about 5 points since our trade reveal date. Today the mid-point net bid/ask quote on our bull/put option spread trade was at $0.01, which would've given us a high probability of closing out the trade at net debit of about $0.02 and making us a profit yield of 9.7%, which is 91.6% of the maximum gain on the trade. In our example trade we traded 20 contracts at a net credit of $0.24, and with each contract controlling 100 shares of stock, that's a net credit of $480 ($0.24 x ( 20 x 100.)) Our net debit is $40 ($0.02 x ( 20 x 100.)) We have a profit value of $440 ($480 - $40.) That's not bad for a 12 day trade.