
A stock chart is the plotting of stock prices at specified time intervals over a specified range of time.
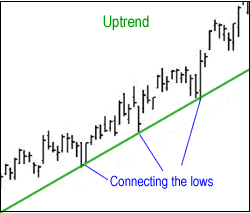
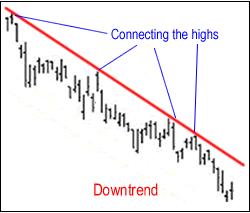
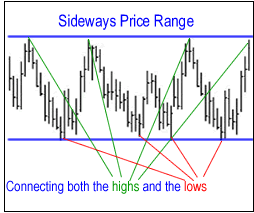
A chart that's established over time will form price patterns from the plotted stock price's highs and lows. When drawing a line to connect the consecutive lows, and consecutive highs, can show whether a stock's price movement is in a downtrend, uptrend or sideways price range.


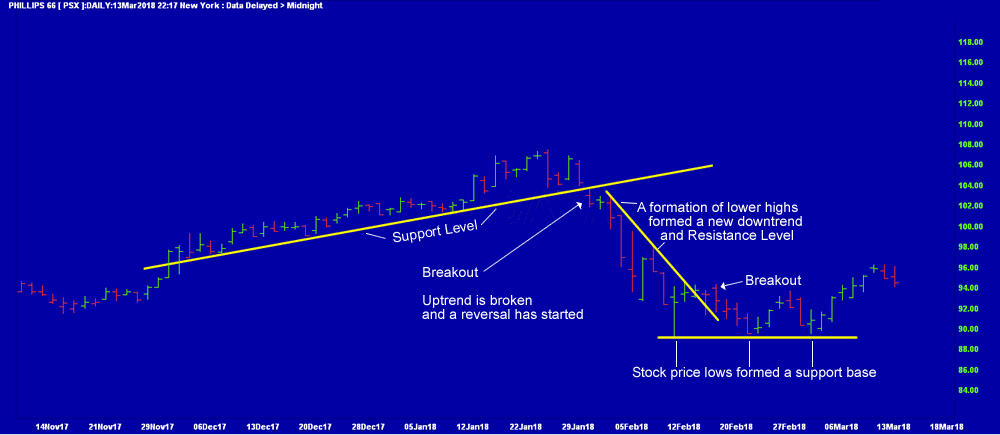
Support and resistance levels - When reading a stock chart, the support and resistance levels are where a stock's price will stop and reverse it's direction of movement. These levels are denoted by multiple touches of prices at the predetermined levels. (See chart image just below.)
What Is a Breakout?
A breakout is a stock price moving through support or resistance level with increased volume. When a breakout occurs, a trader can enter a bullish position after the stock price breaks above resistance or enter a bearish position after the stock breaks below support. Once the stock price trades beyond a support or resistance level, it's price usually trends in the breakout's direction.
What is a Trend Reversal?A Trend Reversal is a change in direction that is opposite of a stock price's current trend, for instance, uptrends that reverse into downtrends and downtrends that reverse into uptrends.
